Illinois State Geological Survey
HVSR Progress summary
by Hongyu(Jeff) Xiao
1. IRIS-HVSR
1.1 Project Source
GitHub - iris-edu/HVSR: A set of Python scripts to compute and plot HVSR curves using MUSTANG PDF-PSD web service from IRIS
A set of Python scripts to compute and plot HVSR curves using MUSTANG PDF-PSD web service from IRIS - GitHub - iris-edu/HVSR: A set of Python scripts to compute and plot HVSR curves using MUSTANG PDF-PSD web service from IRIS
1.2 Anaconda and Jupyter Notebook Setup
- Anaconda
- Install
Anaconda | Anaconda DistributionAnaconda's open-source Distribution is the easiest way to perform Python/R data science and machine learning on a single machine.https://www.anaconda.com/products/distribution

- Conda Cheat Sheet
- Environment Name: HVSR
- Display interface: Jupyter Notebook
- Python Version: 3.8
- Package content:
CHANGES.txt
   - a text file containing the history of changes to this bundle

INSTALL.txt
   - installation notes

README.md
   - this file

bin/
   - scripts directory containing:
        + computeStationChannelBaseline.py (described above)
        + computeHVSR.py (described above)

param/
   - parameters directory containing:
        + getStationChannelBaseline_param.py - the configuration parameter file for the computeStationChannelBaseline.py script above
        + computeHVSR_param.py - the configuration parameter file for the computeHVSR.py script above

lib/
   - bundle library files:
        + fileLib.py - a collection of functions to work with files and directories
        + msgLib.py - a collection of functions to print messages
- Example:
computeHVSR.py - uses IRIS DMC’s MUSTANG noise-psd and noise-pdf web services to compute HVSR for a given station based on the MUSTANG hourly PSDs.
computeStationChannelBaseline.py uses IRIS DMC’s MUSTANG noise-pdf web service to compute channel-specific noise-baseline for a given station
getStationChannelBaseline.py net=IU sta=ANMO loc=00 chan=BHZ start=2002-11-20 end=2008-11-20 plot=1 plotnnm=1 verbose=1 percentlow=10 percenthigh=90computeHVSR.py net=TA sta=TCOL loc=-- chan=BHZ,BHN,BHE start=2013-01-01 end=2013-01-01 plot=1 plotbad=0 plotpsd=0 plotpdf=1 verbose=1 ymax=5 xtype=frequency n=1 removeoutliers=0 method=4
- Report example

- this could be further processed with more analysis
- report comply with SESAME HVSR check standard
1.3 Modefication (refer to the modified py file)
- starttime and end modification
- the original setting:
- if the start date == the end date, it will calculate hvsr over 24 hours of that day
- modefied setting:
- for the purpose of the ISGS work, the field deployment time is normally 20 minutes (up to 1 hour)
- modefied the length requirement to be 1 hour for the station
- this could be furthuer modified to be an hourly estimate
- default length 30/60/90 days in the summer for each station
- calculation based on 1 hour interval
- location: modified py file under bin folder
- the original setting:
- report txt file seperation and save
- saved as txt file with timedate.station.network…txt file
- original setting:
- original setting did not include timedate in the report file
- original setting will only keep one report file and the later runs will replace the existing file
- modefied setting:
- include the timedate into the report file
- file is still in txt format
- files could be further processed by Bash or other scripting language for statistial analysis
- original setting:
- report with SESAME HVSR check for HVSR peak
- location: data or report folder
- saved as txt file with timedate.station.network…txt file
- final result file image save
- saved as jpeg file with timedate.station.network…HVSR jpeg/png file
- original setting:
- with timestamp but overwrite jpegs
- modefied setting:
- include timedate into the file name for scripting
- in jpeg/png format in image folder
- each image containes 3 subplots (H,V, HVSR with peak marked)
- location: image folder
Raspberry Shake
Station View:
RS StationView
 https://stationview.raspberryshake.org/#/?lat=38.00613&lon=-89.83940&zoom=7.000&net=AM&sta=RC345
Data request example URL
https://data.raspberryshake.org/fdsnws/dataselect/1/query?starttime=2022-08-15T20:42:10&endtime=2022-08-16T20:42:10&network=AM&station=RC345
URL Breakdown:
- red colors are contents defined by users
https://data.raspberryshake.org/fdsnws/dataselect/1/query?starttime=
Jupyter Notebook Notes:
2.1 Base modefication (refer to Jupyter file)
- Time, Station,network information setup
- Automatic URL requesting
- Automatic MSEED file downloading
- Automatic MSEED seismic preprocessing (Taper, demean, detrend etc..).
2.2 MSEED to HVSR Bridging Modefication (refer to Jupyter file)
- Bridging the RasShake3D and IRIS-HVSR package
- Probabilistic Power Spectral Densities calculation
- this is the input required by IRIS-HVSR package
- in IRIS-HVSR package, PSD was provided by IRIS MUSTANG service
- Replace the MUSTANG cloud input with MSEED calculated PSD from the pacakge
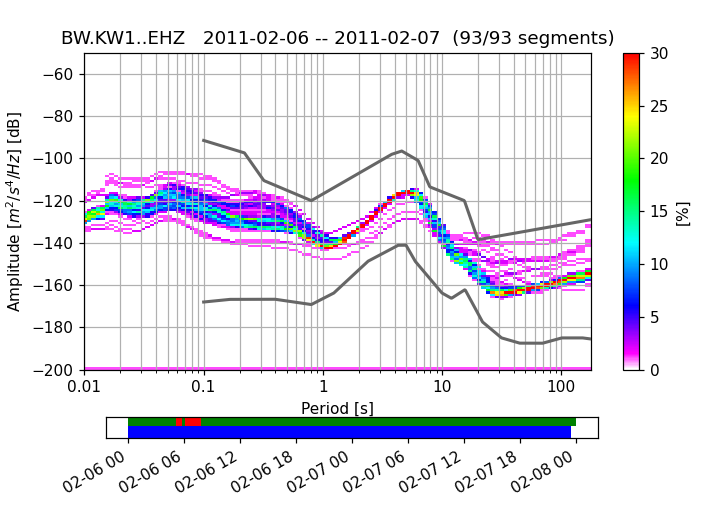
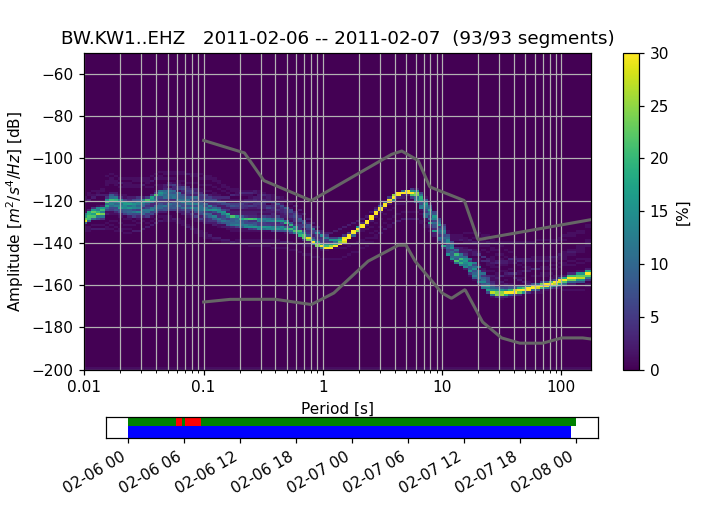
- PPSD Example based on Obspy


- Probabilistic Power Spectral Densities calculation
Reference:
obspy.signal.spectral_estimation.PPSD - ObsPy 1.3.0 documentation
Attributes Public Methods Private Methods Helper routine to get a list of 2-tuples with gapless portions of processed PPSD time ranges. This means that PSD time history is split whenever to adjacent PSD timestamps are not separated by exactly . Reuse a previously created figure returned by plot(show=False) and plot the current histogram stack (pre-computed using ) into the figure.
Visualizing Probabilistic Power Spectral Densities - ObsPy 1.3.0 documentation
The following code example shows how to use the PPSD class defined inobspy.signal . The routine is useful for interpretation of e.g. noise measurements for site quality control checks. For more information on the topic see[McNamara2004] . Read data and select a trace with the desired station/channel combination: Metadata can be provided as an Inventory (e.g.
2.3 Follow-work
- Port-in the aquired PSD into IRIS-HVSR setting
- Could be reformating involved
- Processed PSDs are in XML format
Trimino TRC file decode
Moho Company Email contact:
- Claiming codec to be private and refused to provide codec
TRC file
- Binary
- Non-standared codec
- decoded files follow SAF (SESAME ASCII) format
Hints on the TRC codec decoding
- Tried Codecs
- ISO 8859-1 Western Europe
- ISO 8859-2 Western and Central Europe
- ISO 8859-3 Western Europe and South European (Turkish, Maltese plus Esperanto)
- ISO 8859-7 Greek
- ISO 8859-9 Western Europe with amended Turkish character set
- ISO 8859-10 Western Europe with rationalised character set for Nordic languages, including complete Icelandic set
- ISO 8859-13 Baltic languages plus Polish
- ISO 8859-14 Celtic languages (Irish Gaelic, Scottish, Welsh)
- ISO 8859-15 Added the Euro sign and other rationalisations to ISO 8859-1
- ISO 8859-16 Central, Eastern and Southern European languages (Albanian, Bosnian, Croatian, Hungarian, Polish, Romanian, Serbian and Slovenian, but also French, German, Italian and Irish Gaelic)
 http://services.iris.edu/mustang/


 https://www.geeksforgeeks.org/codecs-decode-in-python/